Pivot Orderflow DeltaThis indicator analyzes order flow by calculating a continuous Cumulative Volume Profile Delta (CVPD). It plots this delta as a series of "delta candles" and identifies divergences and structural pivot levels.
Key Features:
Statistical Delta Engine: For each bar, the indicator builds a high-resolution volume profile on a lower 'Intra-Bar Timeframe'. It uses statistical models ('PDF' allocation) and advanced classifiers ('Dynamic' split) to determine the buy/sell pressure, which is then accumulated.
Cumulative Delta Candle Visualization: The indicator plots the continuous, accumulated delta as a series of candles, where for each bar:
Open: Is the cumulative delta value of the previous bar.
Close: Is the new total cumulative delta.
High/Low: Represent the peak/trough cumulative delta reached during that bar's formation.
Dynamic Pivot Baseline: The indicator plots a separate dynamic baseline ('Impulse Start') that adjusts when a new price pivot is confirmed.
When a price high forms, the baseline moves to the lower of its previous level or the peak delta (max of delta candle O/C) at the pivot.
When a price low forms, the baseline moves to the higher of its previous level or the trough delta (min of delta candle O/C) at the pivot.
Full Divergence Suite (Class A, B, C): A built-in divergence engine automatically detects and plots Regular (A), Hidden (B), and Exaggerated (C) divergences between price and the peak/trough of the delta candles (High/Low).
Detailed Pivot Confluence: The indicator plots distinct markers to differentiate between pivots occurring only on the price chart, only on the delta oscillator, or on both simultaneously.
Note on Confirmation (Lag): Divergence and pivot signals rely on a confirmation method. A pivot is only plotted after the Pivot Right Bars input has passed, which introduces an inherent lag.
Integrated Alerts: Includes 23 comprehensive alerts for:
The start and end of all 6 divergence types.
The detection of a new Impulse Start pivot.
Delta/volume agreement/disagreement.
Delta crossing the zero line.
The formation of price-only or delta-only pivots.
Caution: Real-Time Data Behavior (Intra-Bar Repainting) This indicator uses high-resolution intra-bar data. As a result, the values on the current, unclosed bar (the real-time bar) will update dynamically as new intra-bar data arrives. This behavior is normal and necessary for this type of analysis. Signals should only be considered final after the main chart bar has closed.
DISCLAIMER
For Informational/Educational Use Only: This indicator is provided for informational and educational purposes only. It does not constitute financial, investment, or trading advice, nor is it a recommendation to buy or sell any asset.
Use at Your Own Risk: All trading decisions you make based on the information or signals generated by this indicator are made solely at your own risk.
No Guarantee of Performance: Past performance is not an indicator of future results. The author makes no guarantee regarding the accuracy of the signals or future profitability.
No Liability: The author shall not be held liable for any financial losses or damages incurred directly or indirectly from the use of this indicator.
Signals Are Not Recommendations: The alerts and visual signals (e.g., crossovers) generated by this tool are not direct recommendations to buy or sell. They are technical observations for your own analysis and consideration.
Search in scripts for "volume profile"

ProScalper📊 ProScalper - Professional 1-Minute Scalping System
🎯 Overview
ProScalper is a sophisticated, multi-confluence scalping indicator designed specifically for 1-minute chart trading. Combining advanced technical analysis with intelligent signal filtering, it provides high-probability trade setups with clear entry, stop loss, and take profit levels.
✨ Key Features
🔺 Smart Signal Detection
Range Filter Technology: Fast-responding trend detection (25-period) optimized for 1-minute timeframe
Medium-sized triangles appear above/below candles for clear buy/sell signals
Only most recent signal shown - no chart clutter
Automatically deletes old signals when new ones appear
📋 Real-Time Signal Table
Top-center display shows complete trade breakdown
Grade system: A+, A, B+, B, C+ ratings for every setup
All confluence reasons listed with checkmarks
Score and R:R displayed for instant trade quality assessment
Color-coded: Green for LONG, Red for SHORT
📐 Multi-Confluence Analysis
ProScalper combines 10+ technical factors:
✅ EMA Trend: 4 EMAs (200, 48, 13, 8) for multi-timeframe alignment
✅ VWAP: Dynamic support/resistance
✅ Fibonacci Retracement: Golden ratio (61.8%), 50%, 38.2%, 78.6%
✅ Range Filter: Adaptive trend confirmation
✅ Pivot Points: Smart reversal detection
✅ Volume Analysis: Spike detection and volume profile
✅ Higher Timeframe: 5-minute trend confirmation
✅ HTF Support/Resistance: Key levels from higher timeframes
✅ Liquidity Sweeps: Smart money detection
✅ Opening Range Breakout: First 15-minute range
💰 Complete Trade Management
Entry Lines: Dashed green (LONG) or red (SHORT) showing exact entry
Stop Loss: Red dashed line with price label
Take Profit: Blue dashed line with price label and R:R
Partial Exits: 1R level marked with orange dashed line
All lines extend 10 bars for clean alignment with Fibonacci levels
📊 Dynamic Risk/Reward
Adaptive R:R calculation based on market volatility
Targets adjusted for pivot distances
Minimum 1.2:1 to maximum 3.5:1 for scalping
Position sizing based on account risk percentage
🎨 Professional Visualization
Clean chart layout - no clutter, only essential information
Custom EMA colors: Red (200), Aqua (48), Green (13), White (8)
Gold VWAP line for key support/resistance
Color-coded Fibonacci: Bright yellow (61.8%), white (50%), orange (38.2%), fuchsia (78.6%)
No shaded zones - pure price action focus
📈 Performance Tracking
Real-time statistics table (optional)
Win rate, total trades, P&L tracking
Average R:R and win/loss ratios
Setup-specific performance metrics
⚙️ Settings & Customization
Risk Management
Adjustable account risk per trade (default: 0.5%)
ATR-based stop loss multiplier (default: 0.8 for tight scalping)
Dynamic position sizing
Signal Sensitivity
Confluence Score Threshold: 40-100 (default: 55 for balanced signals)
Range Filter Period: 25 bars (fast signals for 1-min)
Range Filter Multiplier: 2.2 (tighter bands for more signals)
Visual Controls
Toggle signal table on/off
Show/hide Fibonacci levels
Control EMA visibility
Adjust table text size
Partial Exits
1R: 50% (default)
2R: 30% (default)
3R: 20% (default)
Fully customizable percentages
Trailing Stops
ATR-Based (best for scalping)
Pivot-Based
EMA-Based
Breakeven trigger at 0.8R
🎯 Best Use Cases
Ideal For:
✅ 1-minute scalping on liquid instruments
✅ Day traders looking for quick 2-8 minute trades
✅ High-frequency trading with 8-15 signals per session
✅ Trending markets where Range Filter excels
✅ Crypto, Forex, Futures - works on all liquid assets
Trading Style:
Timeframe: 1-minute (can work on 3-5 min with adjusted settings)
Hold Time: 3-8 minutes average
Target: 1.2-3R per trade
Frequency: 8-15 signals per day
Win Rate: 45-55% (with proper risk management)
📋 How to Use
Step 1: Wait for Signal
Watch for green triangle (BUY) or red triangle (SELL)
Signal table appears at top center automatically
Step 2: Review Confluence
Check grade (prefer A+, A, B+ for best quality)
Review all reasons listed in table
Confirm score is above your threshold (55+ recommended)
Note the R:R ratio
Step 3: Enter Trade
Enter at current market price
Set stop loss at red dashed line
Set take profit at blue dashed line
Mark 1R level (orange line) for partial exit
Step 4: Manage Trade
Exit 50% at 1R (orange line)
Move to breakeven after 0.8R
Trail remaining position using your chosen method
Exit fully at TP or opposite signal
🎨 Chart Setup Recommendations
Optimal Display:
Timeframe: 1-minute
Chart Type: Candles or Heikin Ashi
Background: Dark theme for best color visibility
Volume: Enable volume bars below chart
Complementary Indicators (optional):
Order flow/Delta for institutional confirmation
Market profile for key levels
Economic calendar for news avoidance
⚠️ Important Notes
Risk Disclaimer:
Not financial advice - for educational purposes only
Always use proper risk management (0.5-1% per trade max)
Past performance doesn't guarantee future results
Test on demo account before live trading
Best Practices:
✅ Trade during high liquidity hours (9:30-11 AM, 2-4 PM EST)
✅ Avoid news events and market open/close (first/last 2 minutes)
✅ Use tight stops (0.8-1.0 ATR) for 1-minute scalping
✅ Take partial profits quickly (1R = 50% off)
✅ Respect max daily loss limits (3% recommended)
✅ Focus on A and B grade setups for consistency
What Makes This Different:
🎯 Complete system - not just signals, but full trade management
📊 Multi-confluence - 10+ factors analyzed per trade
🎨 Professional visualization - clean, focused chart design
⚡ Optimized for 1-min - settings specifically tuned for fast scalping
📋 Transparent reasoning - see exactly why each trade was taken
🏆 Grade system - instantly know trade quality
🔧 Technical Details
Pine Script Version: 5
Overlay: Yes (plots on price chart)
Max Lines: 500
Max Labels: 100
Non-repainting: All signals confirmed on bar close
Alerts: Compatible with TradingView alerts
📞 Support & Updates
This indicator is actively maintained and optimized for 1-minute scalping. Settings can be adjusted for different timeframes and trading styles, but default configuration is specifically tuned for high-frequency 1-minute scalping.
🚀 Get Started
Add ProScalper to your 1-minute chart
Adjust settings to your risk tolerance
Wait for signals (green/red triangles)
Follow the signal table guidance
Manage trades using provided levels
Track performance with stats table
Happy Scalping! 📊⚡💰

VolumeAnlaysis### Volume Analysis (VA) Indicator
**Overview**
The Volume Analysis (VA) indicator is a dynamic overlay tool designed for traders seeking to identify high-volume breakouts, retests, and multi-timeframe volume-driven price cycles. By combining volume spikes with price action and support/resistance boxes, it highlights potential trend continuations, reversals, and cycle shifts. Ideal for intraday and swing trading on stocks, forex, or crypto, it uses a Fibonacci-inspired 1.618 multiplier to detect significant volume surges, then maps them to visual boxes and key levels for actionable insights.
This indicator draws from volume profile concepts but focuses on **breakout confirmation** and **cycle momentum**, helping you spot when "smart money" volume aligns with price extremes. It's particularly useful in volatile markets where volume precedes price moves.
**How It Works**
1. **Volume Break Detection**:
- Identifies a "Volume Break" when the current bar's volume exceeds 1.618x the highest volume from the prior 5 bars. This signals unusual activity, often preceding breakouts.
- A "Volume Retest" triggers exactly 3 bars after a break if volume has been falling steadily over those 3 bars—indicating a pullback for re-accumulation/distribution.
2. **Visual Annotations**:
- **Labels**: Green/red/yellow labels mark Volume Breaks and Retests, positioned above/below the bar based on candle direction for clarity.
- **Demand/Supply Boxes**:
- Blue semi-transparent boxes form around Retest bars, extending rightward to act as dynamic support/resistance.
- Green (bullish) or red (bearish) boxes draw from Volume Breaks, based on the original candle's open/close, highlighting potential zones for continuation.
- Limited to 5 boxes max to avoid chart clutter; older boxes fade as new ones form.
3. **Box Interaction Signals**:
- When price enters a box:
- **Reversal Hints**: Maroon (bearish rejection) or lime (bullish rejection) labels on closes against the trend with opening price momentum.
- **Breakout Arrows**: Up/down arrows on crossovers/crossunders of box tops/bottoms from Retest boxes.
- Scans all active boxes for interactions, prioritizing recent volume events.
4. **Multi-Timeframe Volume Cycles**:
- Aggregates the "Volume Break Max" level (a proxy for key price extremes tied to volume spikes) across timeframes: 1min, 5min, 10min, 30min, and 65min (using `request.security`).
- Computes **MaxVolBreak** (highest extreme) and **MinVolBreak** (lowest extreme) for trend-following levels.
- Tracks **Percent Volume Greater/Less Than Close**: Sums volumes from TFs where price is below/above these levels, creating a momentum ratio.
- **CrossClose**: Plots the prior close where this ratio crosses (gray line), signaling cycle shifts—bullish below MinVolBreak, bearish above MaxVolBreak.
- **Fills**: Red fill above CrossClose/MaxVolBreak (bearish cycle); green below CrossClose/MinVolBreak (bullish cycle).
5. **Plots**:
- Black lines for MaxVolBreak (⏫) and MinVolBreak (⏬).
- Gray 🔄 for CrossClose.
- Colors dynamically adjust (green/red) based on close relative to levels.
**Key Features**
- **Trend vs. Reversal Modes**: Toggle alerts for trend-following breaks (crosses of Max/MinVolBreak) or reversal signals (crosses of CrossClose).
- **Multi-TF Fusion**: Optionally include the chart's native timeframe in Max/Min calculations for finer tuning.
- **Box Management**: Auto-prunes to 5 boxes; focuses on retest/break alignments for "inside bar" logic.
- **Momentum Filters**: Uses rising/falling opens and crossovers for label precision, reducing noise.
- **Customizable**: Simple inputs for alert visibility and timeframe inclusion.
**Settings**
| Input | Default | Description |
|-------|---------|-------------|
| Show Volume Reversal Breaks | False | Enables alerts/labels for CrossClose crosses (cycle reversals). |
| Show Trend Following Breaks | True | Enables alerts for Max/MinVolBreak crosses (trend signals). |
| Use Current Time | False | Includes chart's native TF in multi-TF Max/Min calculations. |
**Alerts**
- **Reversal Alerts** (if enabled): "Volume Reverse Bullish/Bearish Break of " on close crosses of CrossClose.
- **Trend Alerts** (if enabled): "Trend Volume Bullish/Bearish Signal" on close crosses of Max/MinVolBreak; plus notes if prior low/high aligns with levels.
- All alerts include ticker and level value for easy scanning. Use `alert.freq_once_per_bar` to avoid spam.
**Trading Ideas**
- **Bullish Entry**: Green box formation + price holding MinVolBreak + upward arrow on retest box. Target next resistance.
- **Bearish Entry**: Red box + close above MaxVolBreak + red fill activation. Stop below recent low.
- **Cycle Trading**: Watch CrossClose crosses for regime shifts—fade extremes in overextended cycles.
- **Best Timeframes**: 5-30min for intraday; combine with daily for swings. Works best on liquid assets with reliable volume data.
**Limitations & Notes**
- Relies on accurate volume data (e.g., stocks/forex); less effective on low-volume or synthetic instruments.
- Boxes extend rightward but don't auto-delete—monitor for clutter on long histories (max_bars_back=500).
- Some logic (e.g., exact 3-bar retest) is rigid; backtest for your market.
- Open-source under MPL 2.0—fork and tweak as needed!
For questions or enhancements, drop a comment below. Happy trading! 🚀

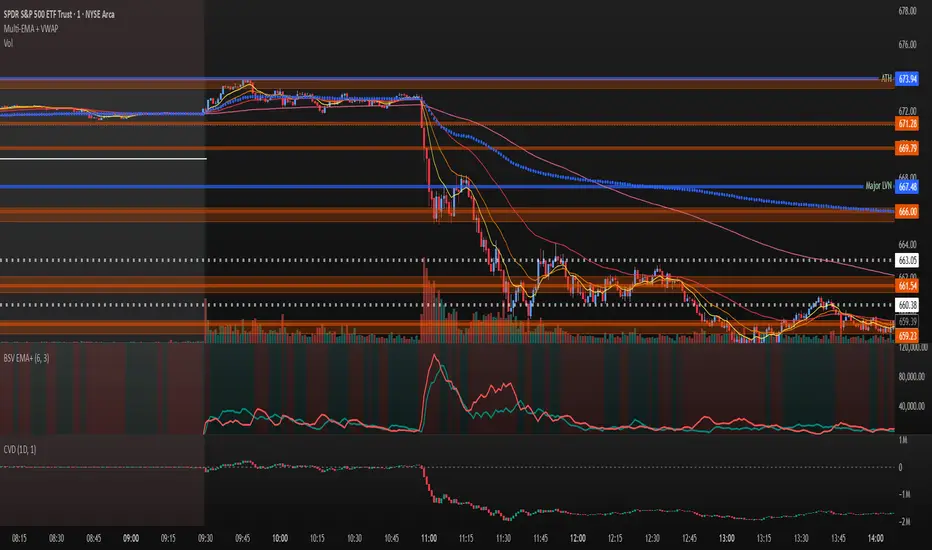
Volume Exponential Moving Averages (EMA)
Description:
This script is a simple script that plots a desired exponential moving average of buy and sell volume as a line chart with a tunable smoothing factor. There is a highlight on the plot area of either green or red to denote if the EMA of buy volume or sell volume is of a higher value. This indicator uses basic math of exponential averages and calculates volume using the formulas: "buy volume" = the product of total volume and the "closing price" minus the "low price" divided by "high price" minus the "low price" for a specific candle. Conversely, "sell volume" = the product of "total volume" and the "high price" minus the "close price" divided by "high price" minus the "low price" for a specific candle.
Utility:
This indicator is an effective way to gauge the acceleration/ deceleration of buyers and sellers in the market and can be used in combination with market structure and important levels to understand if buyers or sellers are taking over at any given time.
How to use this indicator:
There are two settings for this indicator:
1. The Length of the EMA: The length of the EMA can be adjusted based on your preference for a running number of candles' data. If you are interested to know short term changes in volume (e.g. over the past few candles at a major level) you can adjust this setting lower (~3-9 length). Conversely, if you are interested in volume trends over a greater number of candles you can increase this to your liking.
Personal preference : Because I am a short term daytrader/ scalper, I keep this setting at 6 length to see immediate changes in the acceleration or deceleration of buyers/ sellers.
2. The Smoothing Factor: The smoothing factor can be adjusted to further tune the size of trend you are interested in with 1 = No smoothing of the EMA line. Smoothing of the EMA line increases as the value for smoothing increases, resulting in a less volatile, more smooth EMA line. However, the more smooth the line, the less sensitive the EMA will be to immediate changes in volume pace. The less smoothing factor is applied, the more volatile data will be, resulting in quicker observation of shorter term trends. Again the same rules apply as the EMA length as these are similar in function: If you are interested to know short term changes in volume (e.g. over the past few candles at a major level) you can adjust this setting lower (~2-6). Conversely, if you are interested in volume trends over a greater number of candles you can increase this to your liking.
Personal preference : Because I am a short term daytrader/ scalper, I keep this setting at 2-4 smoothing factor to see immediate changes in the acceleration or deceleration of buyers/ sellers.
You should, of course, play with these settings to your exact preferences based on your trading style.
Tips for using this indicator:
General Use:
When the buy volume EMA is moving up, buyers are increasing the pace of buying and when the buy volume EMA is moving down, buyers are decreasing the pace of buying. Conversely, when the sell volume EMA is moving up, sellers are increasing the pace of selling and when the sell volume EMA is moving down, sellers are decreasing the pace of selling. The overall movement of the stock is relative to the combination of these rates. e.g. If both buyers and sellers are increasing at the same rate (EMAs slopes are roughly equal) there will be not a large change in price. If the slope of the buy volume EMA is greater than the slope of sell volume EMA, the price should move up. Conversely, if the slope of the sell volume EMA is greater than the slope of buy volume EMA, the price should move down.
Predicting pullbacks, reversals, and continuations:
This indicator allows you to see if buyers or sellers are increasing their pace, even if the stock price is in consolidation. This allows you to predict if out of the consolidation buyers or sellers are likely to win based on the momentum of the volume in consolidation. e.g. If price is in consolidation after an uptrend and the buy volume EMA starts to decrease, this could be a sign that buyers are running out of steam at this price level. Another example, If at a major support the buy volume EMA begins to trend up then buyers are accelerating the pace of buying at this level.
EMA crosses: There is something to be said about the point at which the buy volume EMA and sell volume EMA cross. This signifies that at this moment there is a shift in which the acceleration of one party outpaces that of the other and can result in increased speed of the movement of the stock price.
Considerations
Because volume changes constantly, this indicator is best to identify short term changes in volume that could impact price movements. It is not guaranteed to continue just because buyers or sellers have had a change in pace. Therefore it is advised to use this indicator in combination with significant price levels such as pivot points, or price levels from volume profile tools to identify the price zones where significant volume changes are likely to impact price movements. It is also advised to continue to monitor the changes in pace in buyers and sellers using this volume EMA indicator to determine if a change in pace is short lived or if it will continue for a longer duration.
Examples of use:
Bullish Reversal:
Bearish Continuation:
Bearish EMA Crossover: (Settings: Length 6, Smoothing factor 3)
Bullish EMA Crossover: (Settings: Length 6, Smoothing factor 4)
RVol+ Enhanced Relative Volume Indicator📊 RVol+ Enhanced Relative Volume Indicator
Overview
RVol+ (Relative Volume Plus) is an advanced time-based relative volume indicator designed specifically for swing traders and breakout detection. Unlike simple volume comparisons, RVol+ analyzes volume at the same time of day across multiple sessions, providing statistically significant insights into institutional activity and breakout potential.
🎯 Key Features
Core Volume Analysis
Time-Based RVol Calculation - Compares current cumulative volume to the average volume at this exact time over the past N days
Statistical Z-Score - Measures volume in standard deviations from the mean for true anomaly detection
Volume Percentile - Shows where current volume ranks historically (0-100%)
Sustained Volume Filter - 3-bar moving average prevents false signals from single-bar spikes
Breakout Detection
🚀 Confirmed Breakouts - Identifies price breakouts validated by high volume (RVol > 1.5x)
⚠️ False Breakout Warnings - Alerts when price breaks key levels on low volume (high failure risk)
Multi-Timeframe Context - Weekly volume overlay prevents chasing daily noise
Advanced Metrics
OBV Divergence Detection - Spots bullish/bearish accumulation/distribution patterns
Volume Profile Integration - Identifies institutional positioning
Money Flow Analysis - Tracks smart money vs retail activity
Extreme Volume Alerts - 🔥 Labels mark unusual spikes beyond the display cap
Visual Intelligence
Smart Color Coding:
🟢 Bright Teal = High activity (RVol ≥ 1.5x)
🟡 Medium Teal = Caution zone (RVol ≥ 1.2x)
⚪ Light Teal = Normal activity
🟠 Orange = Breakout confirmed
🔴 Red = False breakout risk
Comprehensive Stats Table:
Current Volume (formatted as M/K/B)
RVol ratio
Z-Score with significance
Volume percentile
Historical average and standard deviation
Sustained volume confirmation
📈 How to Use
For Swing Trading (1D - 3W Holds)
Perfect Setup:
✓ RVol > 1.5x (bright teal)
✓ Z-Score > 2.0 (⚡ alert)
✓ Percentile > 90%
✓ Sustained = ✓
✓ 🚀 Breakout label appears
Avoid:
✗ Red "Low Vol" warning during breakouts
✗ RVol < 1.0 at key levels
✗ Sustained volume not confirmed
Signal Interpretation
⚡ Z>2 Labels - Statistically significant volume (95th+ percentile) - highest probability moves
↗️ OBV+ Labels - Bullish accumulation (OBV rising while price consolidates)
↘️ OBV- Labels - Bearish distribution (OBV falling while price rises)
🔵 Blue Background - Weekly volume elevated (confirms daily strength)
⚙️ Customization
Basic Settings
N Day Average - Number of historical days for comparison (default: 5)
RVol Thresholds - Customize highlight levels (default: 1.2x, 1.5x)
Visual Display Cap - Prevent extreme spikes from compressing view (default: 4.0x)
Advanced Metrics (Toggle On/Off)
Z-Score analysis
Weekly RVol context
OBV divergence detection
Volume percentile ranking
Breakout signal generation
Table Customization
Position - 9 placement options to avoid chart overlap
Size - Tiny to Huge
Colors - Full customization of positive/negative/neutral values
Transparency - Adjustable background
Debug Mode
Enable Pine Logs for calculation transparency
Adjustable log frequency
Real-time calculation breakdown
🔬 Technical Details
Algorithm:
Binary search for historical lookups (O(log n) performance)
Time-zone aware session detection
DST-safe timestamp calculations
Exponentially weighted standard deviation
Anti-repainting architecture
Performance:
Optimized for max_bars_back = 5000
Efficient array management
Built-in function optimization
Memory-conscious data structures
📊 What Makes RVol+ Different?
vs. Standard Volume:
Context-aware (time-of-day matters)
Statistical significance testing
False breakout filtering
vs. Basic RVol:
Z-Score normalization (2-3 sigma detection)
Multi-timeframe confirmation
OBV divergence integration
Sustained volume filtering
Smart visual scaling
vs. Professional Tools:
Free and open-source
Fully customizable
No black-box algorithms
Educational debug logs
💡 Best Practices
Wait for Confirmation - Don't enter on first bar; wait for sustained volume ✓
Combine with Price Action - RVol validates, price structure determines entry
Weekly Context Matters - Blue background = institutional interest
Z-Score is King - Focus on ⚡ alerts for highest probability
Avoid Low Volume Breakouts - Red ⚠️ labels = high failure risk
🎓 Trading Psychology
Volume precedes price. When RVol+ shows:
High RVol + Rising OBV = Accumulation before breakout
High RVol at Resistance = Test of conviction
Low RVol on Breakout = Retail-driven (fade candidate)
Z-Score > 3 = Potential "whale" positioning
📝 Credits
Based on the time-based RVol concept from /u/HurlTeaInTheSea, enhanced with:
Statistical analysis (z-scores, percentiles)
Multi-timeframe integration
OBV divergence detection
Professional-grade visualization
Swing trading optimization
🔧 Version History
v2.0 - Enhanced Edition
Added Z-Score analysis
Multi-timeframe volume context
OBV divergence detection
Breakout confirmation system
Smart color coding
Customizable stats table
Debug logging mode
Performance optimizations
📚 Learn More
For optimal use with swing trading:
Combine with support/resistance levels
Watch for volume clusters in consolidation
Use weekly timeframe for trend confirmation
Monitor OBV divergence for early warnings
⚠️ Disclaimer
This indicator is for educational purposes. Volume analysis is one component of trading decisions. Always use proper risk management, consider multiple timeframes, and validate signals with price structure. Past performance does not guarantee future results.
🚀 Getting Started
Add indicator to chart
Adjust "N Day Average" to your preference (5-10 days typical)
Position stats table to avoid overlap
Enable features you want to monitor
Watch for 🚀 breakout confirmations!
Happy Trading! 📈

Liquidity Void Detector (Zeiierman)█ Overview
Liquidity Void Detector (Zeiierman) is an oscillator highlighting inefficient price displacements under low participation. It measures the most recent price move (standardized return) and amplifies it only when volume is below its own trend.
Positive readings ⇒ strong up-move on low volume → potential Buy-Side Imbalance (void below) that often refills.
Negative readings ⇒ strong down-move on low volume → potential Sell-Side Imbalance (void above) that often refills.
This tool provides a quantitative “void” proxy: when price travels far with unusually thin volume, the move is flagged as likely inefficient and prone to mean-reversion/mitigation.
█ How It Works
⚪ Volume Shock (Participation Filter)
Each bar, volume is compared to a rolling baseline. This is then z-scored.
// Volume Shock calculation
volTrend = ta.sma(volume, L)
vs = (volume > 0 and volTrend > 0) ? math.log(volume) - math.log(volTrend) : na
vsZ = zScore(vs, vzLen) // z-scored volume shock
lowVS = (vsZ <= vzThr) // low-volume condition
Bars with VolShock Z ≤ threshold are treated as low-volume (thin).
⚪ Prior Return Extremeness
The 1-bar log return is computed and z-scored.
// Prior return extremeness
r1 = math.log(close / close )
retZ = zScore(r1, rLen) // z-scored prior return
This shows whether the latest move is unusually large relative to recent history.
⚪ Void Oscillator
The oscillator is:
// Oscillator construction
weight = lowVS ? 1.0 : fadeNoLow
osc = retZ * weight
where Weight = 1 when volume is low, otherwise fades toward a user-set factor (0–1).
Osc > 0: up-move emphasized under low volume ⇒ Buy-Side Imbalance.
Osc < 0: down-move emphasized under low volume ⇒ Sell-Side Imbalance.
█ Why Use It
⚪ Targets Inefficient Moves
By filtering for low participation, the oscillator focuses on moves most likely driven by thin books/noise trading, which are statistically more likely to retrace.
⚪ Simple, Robust Logic
No need for tick data or order-book depth. It derives a practical void proxy from OHLCV, making it portable across assets and timeframes.
⚪ Complements Price-Action Tools
Use alongside FVG/imbalance zones, key levels, and volume profile to prioritize voids that carry the highest reversal probability.
█ How to Use
Sell-Side Imbalance = aggressive sell move (price goes down on low volume) → expect price to move up to fill it.
Buy-Side Imbalance = aggressive buy move (price goes up on low volume) → expect price to move down to fill it.
█ Settings
Volume Baseline Length — Bars for the volume trend used in VolShock. Larger = smoother baseline, fewer low-volume flags.
Vol Shock Z-Score Lookback — Bars to standardize VolShock; larger = smoother, fewer extremes.
Low-Volume Threshold (VolShock Z ≤) — Defines “thin participation.” Typical: −0.5 to −1.0.
Return Z-Score Lookback — Bars to standardize the 1-bar log return; larger = smoother “extremeness” measure.
Fade When Volume Not Low (0–1) — Weight applied when volume is not low. 0.00 = ignore non-low-volume bars entirely. 1.00 = treat volume condition as irrelevant (pure return extremeness).
Upper Threshold (Osc ≥) — Trigger for Sell-Side Imbalance (void below).
Lower Threshold (Osc ≤) — Trigger for Buy-Side Imbalance (void above).
-----------------
Disclaimer
The content provided in my scripts, indicators, ideas, algorithms, and systems is for educational and informational purposes only. It does not constitute financial advice, investment recommendations, or a solicitation to buy or sell any financial instruments. I will not accept liability for any loss or damage, including without limitation any loss of profit, which may arise directly or indirectly from the use of or reliance on such information.
All investments involve risk, and the past performance of a security, industry, sector, market, financial product, trading strategy, backtest, or individual's trading does not guarantee future results or returns. Investors are fully responsible for any investment decisions they make. Such decisions should be based solely on an evaluation of their financial circumstances, investment objectives, risk tolerance, and liquidity needs.

Manual VAH/VAL LevelsManual VAH/VAL Levels is a utility indicator that lets traders manually display the Value Area High (VAH) and Value Area Low (VAL) from the prior trading day, based on a Fixed Range Volume Profile tool.
This script is designed to:
Draw horizontal lines at the manually input VAH and VAL levels
Label each line with the corresponding price, aligned clearly to the right of the chart
Display levels only during the regular trading session for focused market context
Maintain a clean chart appearance with transparent label backgrounds
💡 How to Use:
Apply TradingView's Fixed Range Volume Profile tool to the prior day's session
Manually enter the VAH and VAL values into the script settings
The script will draw and label these levels dynamically during the NY market session
This tool is ideal for:
Traders using volume-based key levels for intraday decision-making
Contextualizing price action near areas of prior day value
Confluence analysis when paired with opening range, CVD, or breakout systems

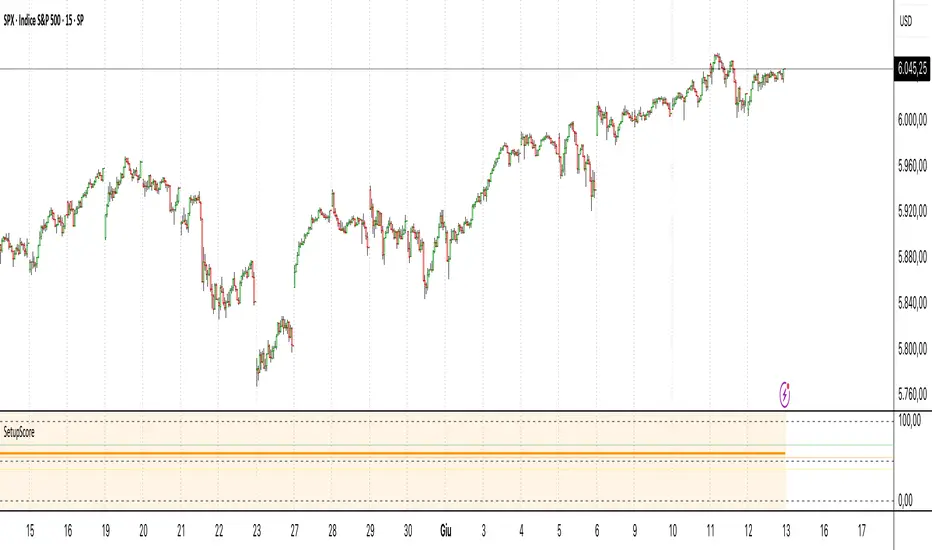
Setup Score OscillatorSetup Score Oscillator – Full Description
🎯 Purpose of the Script
This script is a manual trading setup scoring tool, designed to help traders quantify the quality of a trade setup by combining multiple technical, cyclical, and contextual signals.
Instead of relying on a single indicator, the trader manually selects which signals are present, and the script calculates a total score (0–100%), displayed as an oscillator in a separate panel (like RSI or MACD).
🔧 How it works in practice
1. Manual signal inputs
The script presents a set of checkboxes in the settings, where the trader can enable/disable the following signals:
✅ Confirmed Support/Resistance
✅ Aligned Volume Profile
✅ Favorable Cyclic Timing
✅ Valid Trend Line
✅ Aligned Cyclical Moving Averages
✅ Relevant Fibonacci Level
✅ Classic Volume Signal (spike, dry-up, etc.)
✅ Oscillator confirmation (e.g., divergences)
✅ Extreme Sentiment
✅ Relevant or incoming News
Each selected signal contributes to the total score based on its weight.
2. Scoring system
Each signal has a default weight (e.g., 20% for support/resistance, 15% for cycles, etc.).
Optionally, the trader can enable the “custom weights” checkbox and adjust each signal’s weight directly in the settings.
3. Score visualization
The final score (sum of all active weights) is plotted as an oscillator ranging from 0 to 100%, with dynamic coloring:
Range Color Meaning
0–39% Red No valid setup
40–54% Yellow Watchlist only
55–69% Orange Good setup
70–100% Green Strong setup
Several horizontal threshold lines are displayed:
50% → neutral threshold
40%, 55%, 70% → operational levels
4. Optional background coloring
When the score exceeds 55% or 70%, the oscillator background lightly changes color to highlight stronger setups (non-intrusive).
📌 Practical benefits
Objectifies subjective analysis: each decision becomes a number.
Prevents overtrading: no entries if the score is too low.
Adaptable to any trading style: swing, intraday, positional.
User-friendly: no coding needed – just tick boxes.
Italiano:
Setup Score Oscillator – Descrizione completa
🎯 Obiettivo dello script
Lo script è uno strumento manuale di valutazione dei setup di trading, pensato per aiutare il trader a quantificare la qualità di un'opportunità operativa basandosi su più segnali tecnici, ciclici e contestuali.
Invece di affidarsi a un solo indicatore, il trader seleziona manualmente quali segnali sono presenti, e lo script calcola un punteggio complessivo percentuale (0–100%), rappresentato come oscillatore in una finestra separata (tipo RSI, MACD, ecc.).
🔧 Come funziona operativamente
1. Input manuale dei segnali
Lo script mostra una serie di checkbox nelle impostazioni, dove il trader può attivare o disattivare i seguenti segnali:
✅ Supporto/Resistenza confermata
✅ Volume Profile allineato
✅ Cicli o timing favorevole
✅ Trend line valida
✅ Medie mobili cicliche allineate
✅ Livello di Fibonacci rilevante
✅ Volume classico significativo (spike, dry-up)
✅ Conferme da oscillatori (es. divergenze)
✅ Sentiment estremo (es. euforia o panico)
✅ News importanti imminenti o appena uscite
Ogni casella attiva contribuisce al punteggio totale, con un peso specifico.
2. Sistema di punteggio
Ogni segnale ha un peso predefinito (es. 20% per supporti/resistenze, 15% per cicli, ecc.).
Facoltativamente, il trader può attivare la funzione “Enable custom weights” per personalizzare i pesi di ciascun segnale direttamente da input.
3. Visualizzazione del punteggio
Il punteggio complessivo (somma dei pesi attivati) viene tracciato come oscillatore da 0 a 100%, con colori dinamici:
Range Colore Significato
0–39% Rosso Nessun setup valido
40–54% Giallo Osservazione
55–69% Arancione Setup buono
70–1005 Verde Setup forte
Sono tracciate anche delle linee guida orizzontali a:
50% → soglia neutra
40%, 55%, 70% → soglie operative
4. Colorazione dello sfondo (facoltativa)
Quando il punteggio supera 55% o 70%, lo sfondo dell’oscillatore cambia leggermente colore per evidenziare il segnale (non invasivo).
📌 Vantaggi pratici
Oggettivizza l’analisi soggettiva: ogni decisione manuale si trasforma in un numero.
Evita overtrading: se il punteggio è troppo basso, non si entra.
Adattabile a ogni stile: swing, intraday, position.
Facile da usare anche senza codice: basta spuntare le caselle.
Volume Flow RatioVolume Flow Ratio (VFR) Indicator
Overview
The Volume Flow Ratio (VFR) is a sophisticated volume analysis tool that measures current trading volume relative to the maximum volume of the previous period. Unlike traditional volume indicators that show raw volume or simple moving averages, VFR provides context by comparing current activity to recent maximum activity levels.
Core Features
1. Split Period Analysis
- Multiple Timeframe Options:
- Daily: Compares to previous day's maximum
- Weekly: Week-to-week comparison
- NYSE Weekly: Specialized for stock market trading (Monday-Friday only)
- Monthly: Month-to-month analysis
- Quarterly: Quarter-to-quarter perspective
- Yearly: Year-over-year volume comparison
2. Ratio-Based Measurement
- Displays volume as a ratio (0 to 1+) rather than raw numbers
- 1.0 represents volume equal to previous period's maximum
- Example: If previous max was 50,000 contracts:
- Current volume of 25,000 shows as 0.5
- Current volume of 75,000 shows as 1.5
3. Triple Coloring Modes
- Moving Average Based:
- Compares current ratio to its moving average
- Customizable MA period
- Green: Above MA (higher than average activity)
- Red: Below MA (lower than average activity)
- Previous Candle Comparison:
- Simple increase/decrease from previous bar
- Green: Higher than previous bar
- Red: Lower than previous bar
- Candle Color Based:
- Syncs with price action
- Green: Bullish candles (close > open)
- Red: Bearish candles (close < open)
Primary Use Cases
1. Volume Profile Analysis
- Perfect for traders who need to understand when markets are most active
- Helps identify unusual volume spikes relative to recent history
- Useful for timing entries and exits based on market participation
2. Market Activity Traders
Ideal for traders who:
- Need to identify high-liquidity periods
- Want to avoid low-volume periods
- Look for volume breakouts or divergences
- Trade based on institutional participation levels
3. Mean Reversion Traders
Helps identify:
- Overextended volume conditions (potential reversals)
- Volume exhaustion points
- Return to normal volume levels after spikes
4. Momentum Traders
Useful for:
- Confirming trend strength through volume
- Identifying potential trend exhaustion
- Validating breakouts with volume confirmation
Advantages Over Traditional Volume Indicators
1. Contextual Analysis
- Shows relative strength rather than raw numbers
- Easier to compare across different time periods
- Automatically adjusts to changing market conditions
2. Period-Specific Insights
- Respects natural market cycles (daily, weekly, monthly)
- Special handling for NYSE trading days
- Eliminates weekend noise in stock market analysis
3. Flexible Visualization
- Three distinct coloring methods for different trading styles
- Clear reference line at 1.0 for quick analysis
- Histogram style for easy pattern recognition
Best Practices
For Day Traders
- Use Daily split for intraday volume patterns
- MA coloring mode with shorter periods (5-10)
- Focus on ratios during market hours
For Swing Traders
- Weekly or NYSE Weekly splits
- Longer MA periods (15-20)
- Look for sustained volume patterns
For Position Traders
- Monthly or Quarterly splits
- Candle color mode for trend confirmation
- Focus on major volume shifts
Limitations
- Requires one full period to establish baseline
- May be less effective in extremely low volume conditions
- NYSE Weekly mode specific to stock market hours
This indicator is particularly valuable for traders who understand that volume is a crucial component of price action but need a more sophisticated way to analyze it than simple volume bars. It's especially useful for those who trade based on market participation levels and need to quickly identify whether current volume is significant relative to recent history.

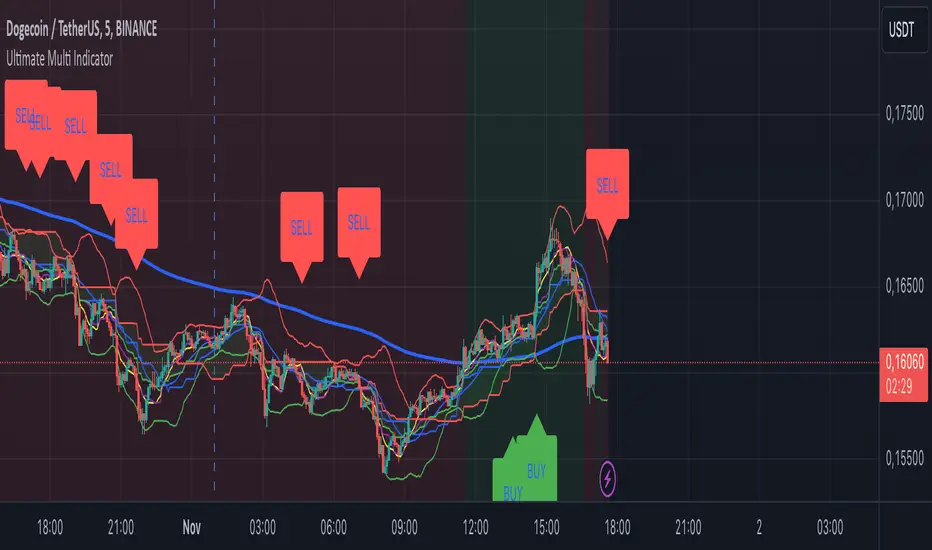
Ultimate Multi Indicator - by SachaThe Ultimate Multi Indicator: The Ultimate Guide To Profit
This custom indicator, the Ultimate Multi Indicator , integrates multiple trading indicators to have powerful buy and sell signals. I combined MACD, EMA, RSI, Bollinger Bands, Volume Profile, and Ichimoku Cloud indicators to help traders analyze both short-term and long-term price movements.
Key Components and How to Use Them
- MACD (Moving Average Convergence Divergence):
- Use for trend direction and potentiality of reversals.
- The blue line (MACD Line) crossing above the orange line (Signal Line) indicates a bullish reversal; the opposite signals a bearish reversal.
- Watch for crossovers to confirm the direction of smaller price movements.
- 200 EMA (Long) (Exponential Moving Average):
- Use to indicate a long-term trend direction.
- If the price is above the 200 EMA, the market is in an uptrend; below it suggests a downtrend.
- The chart’s background color shifts subtly green (uptrend) or red (downtrend) depending on the EMA's relative position.
- RSI (Relative Strength Index):
- Tracks momentum and overbought/oversold levels.
- RSI over 70 signifies overbought conditions; under 30 indicates oversold.
- Look for RSI turning points around these levels to identify potential reversals.
- Bollinger Bands :
- The price touching or crossing the upper Bollinger Band may mean overbought conditions are filled, while a touch at the lower band indicates oversold.
- Bollinger Band interactions often align with key reversal points, especially when combined with other signals.
- Volume Profile :
- A yellow VP line on the chart represents significant trading volume occurred.
- This line can be used as both a support and resistance level, and especially during consolidations or trend changes.
- Ichimoku Cloud :
- Identifies support/resistance levels and trend direction.
- Green and red cloud regions visually show if the price is above (bullish) or below (bearish) key levels.
- Price above the cloud (green) confirms a bullish market, while below (red) signals bearish.
Signal Conditions and Visualization
- Buy Signals :
- This is triggered right away when MACD crosses up, RSI is oversold, or price touches the lower Bollinger Band, provided price is above both the Ichimoku Cloud and the 200 EMA.
- A green “BUY” label appears below the bar, suggesting a potential entry.
- Sell Signals :
- This signal is generated when MACD crosses down, RSI is overbought, or price touches the upper Bollinger Band, and price is below the Ichimoku Cloud and the 200 EMA.
- A red “SELL” label is shown above the bar, indicating a potential exit.
Tips & Tricks
- Confirm Signals : Use multiple signals to confirm entries and exits. For example, if both the MACD and RSI align with the Ichimoku Cloud direction, the trade setup is stronger.
- Trend Directions : Only take buy signals if the price is above the 200 EMA, and sell signals if it is below, aligning trades with the overall trend.
- Adjust for Volatility : In high-volatility markets, especially in the crypto markets, pay close attention to the Bollinger Bands for breakout potential.
- Ichimoku as a Trend Guide : Use the Ichimoku Cloud as a guide for long-term support and resistance levels, especially for swing trades.
This multi-layered indicator gives a balanced blend of short-term signals and long-term trend insights, making it a versatile tool for day trading, swing trading, or even longer-term analysis.
Remember that indicators that will make you rich instantly don't exist. To expect minimum profit from them, you shouldn't trade all you have at the same time but only trade with the money you can afford to lose.
After that being said, I wish you traders luck with the Ultimate Multi Indicator!
VWAP RangeThe VWAP Range indicator is a highly versatile and innovative tool designed with trading signals for trading the supply and demand within consolidation ranges.
What's a VWAP?
A VWAP (Volume Weighted Average Price) represents an equilibrium point in the market, balancing supply and demand over a specified period. Unlike simple moving averages, VWAP gives more weight to periods with higher volume. This is crucial because large volumes indicate significant trading activity, often by institutional traders, whose actions can reflect deeper market insights or create substantial market movements. The VWAP is also often used as a benchmark to evaluate the efficiency of executed trades. If a trader buys below the VWAP and sells above it, they are generally considered to have transacted favourably.
This is how it works:
Multiple VWAP Anchors:
This indicator uses multiple VWAPs anchored to different optional time periods, such as Daily, Weekly, Monthly, as well as to the highest high a lowest low within those periods. This multiplicity allows for a comprehensive view of the market’s average price based on volume and price, tailored to different trading styles and strategies.
Dynamic and Fixed Periods:
Traders can choose between using dynamic ranges, which reset at the start of each selected period, and specifying a date and time for a particular fixed range to trade. This flexibility is crucial for analyzing price movements within specific ranges or market phases.
Fixed ranges allow VWAPs to be calculated and anchored to a significant market event, the beginning of a consolidation phase or after a major news announcement.
Signal Generation:
The indicator generates buy and sell signals based on the relationship of the price to the VWAPs. It also allows for setting a maximum number of signals in one direction to avoid overtrading or pyramiding. Be sure to wait for the candle close before trading on the signals.
Average Buy/Sell Signal Lines:
Lines can be plotted to display the average buy and sell signal prices. The difference between the lines shows the average profit per trade when trading on the signals in that range. It's a good way to see how profitable a range is on average without backtesting the signals. The lines will also often turn into support and resistance areas, similar to value areas in a volume profile.
Customizable Settings:
Traders have control over various settings, such as the VWAP calculation method and bar color. There are also tooltips for every function.
Hidden Feature:
There's a subtle feature in this indicator: if you have 'Indicator values' turned on in TradingView, you'll see a Sell/Buy Ratio displayed only in the status line. This ratio indicates whether there are more sell signals than buy signals in a range, regardless of the Max Signals setting. A red value above 1 suggests that the market is trending upward, indicating you might want to hold your long positions a bit longer. Conversely, a green value below 1 implies a downward trend.

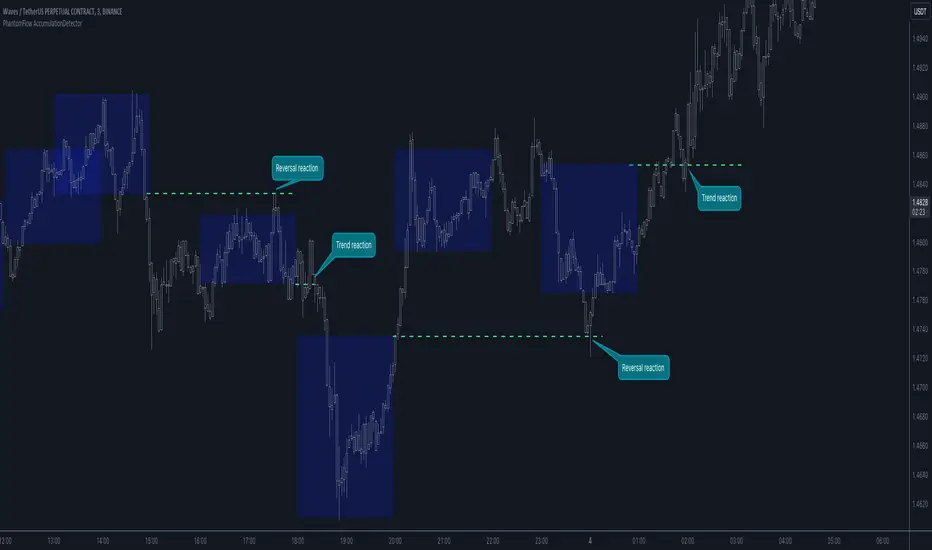
PhantomFlow AccumulationDetectorThe PhantomFlow AccumulationDetector indicator analyzes the volume profile and displays potential accumulation based on the selected timeframe in the settings. This indicator can be used both as zones for trend following and for identifying reversals, as shown in the examples on the chart. The logic behind the formation of the accumulation zone is based on the fact that the POC (Point of Control) of the current zone is within the Volume Area range of the previous period.
Optimal settings for the working timeframe should be chosen visually, and the size of the zones should not be too large or too small. Additionally, it's advisable not to consider overly wide zones during increased volatility.
Consecutive zones within the same range often indicate a potential reversal.
We borrowed the volume profile calculation code from @LonesomeTheBlue. Thank you for the work done!
RSI ProfileThis indicator shows the RSI profile from historical RSI Value and High / Low RSI Pivots.
It is inspired by the Volume Profile which is a common charting study that indicates activity at specified levels. It plots a histogram on the chart meant to identify dominant/significant levels.
This script is profiling RSI levels into a histogram, which can identify the crucial RSI values in the chart. Along with the pivot options that can help identify the dominant pivot points where RSI values had been rebounding historically.
How to use:
There are three profile types available in the settings. When selecting RSI Values, the indicator will count RSI values from history, and plot the count in a histogram at the end of the chart. If you select RSI Pivots High or RSI Pivots Low, the indicator will count only the RSI Pivot Highs and Lows and plot the count in a histogram. Users can select the Pivot Left/Right length from the settings.
Users can extend the POC line to the left, to study how the values had been reacting to POC
Please note: Since the RSi values range from 0 to 100, the indicator is rounding off the values to absolute numbers. This can cause a situation where multiple POC are identified, to find the unique POC, you can increase the width of the histogram.
The Max/Min RSI settings are for visual purposes only, it can help users shrink down the histogram's top and bottom visibility

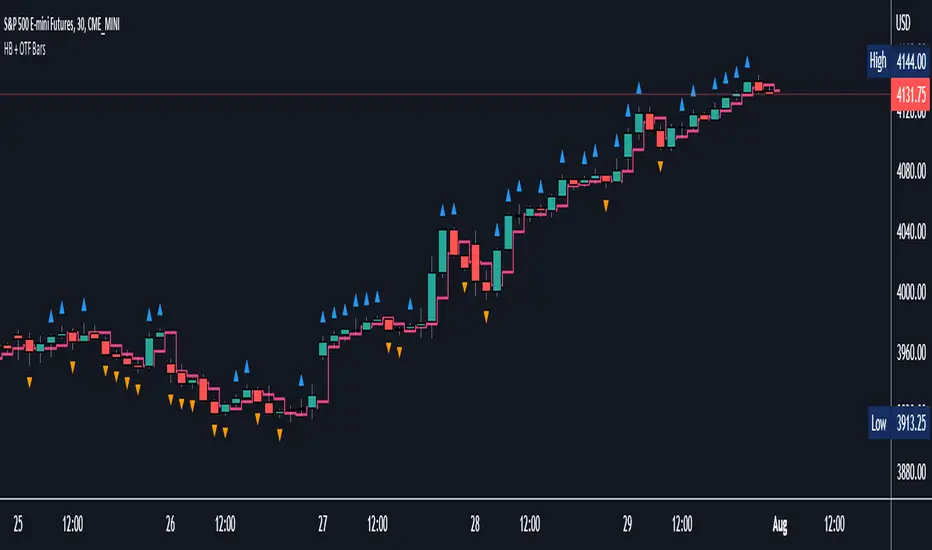
Halfback + One-Time-Framing BarsThis indicator is designed to be used with Market Profile / Volume Profile trading techniques on a 30min chart.
The halfback of a candle is the mid point between the high and the low of the candle. A halfback trade can be taken once price retraces into this point as support/resistance using the prevailing trend as your trade direction.
One-Time-Framing is a fancy term for trending in one direction. One-Time-Framing happens when a candle breaks the previous candle's high without testing the low or when a candle breaks the low of the previous candle without testing the high. This indicates that the trend is one directional and opposing pressure is very weak. Taking trades in the opposing direction of multiple OTF bars is typically a bad trade setup.
Halfback and OTF setups are typically used on a 30min timeframe combined with Market or Volume Profile, but you can experiment with these setups on any timeframe if you wish.
I hope you all enjoy this indicator, comment below if you have any questions.
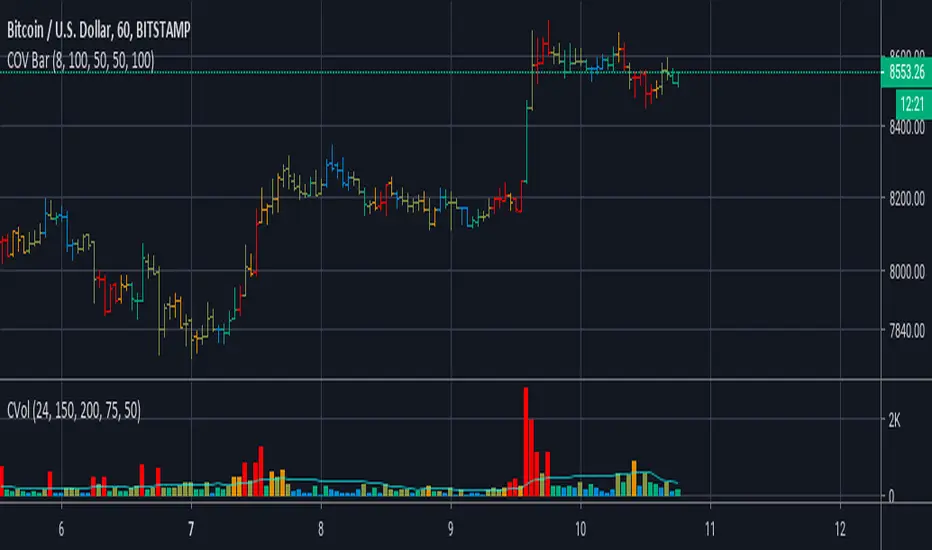
Koalafied Volume Extension BubblesCircles based on extensions from volume Z-Score. Large volume candles can often signal exhaustion or show market strength in reversals or breakouts. Circles can be offset back to the start of the day/profile or left at the time where they occur.
Colours denoting deviations from the mean are
+2 std dev - Green
+1 std dev - Blue
-1 std dev - Red
-2 std dev - Purple
Concept is primarily as a pseudo volume profile delta tool. Obviously it's a very basic heuristic so would recommend further reading and use of actually footprint data to base trading decisions on.

Volume Spikes & Growing Volume Signals With Alerts & ScannerVOLUME SPIKES & GROWING VOLUME SIGNALS WITH ALERTS & SCANNER
This indicator shows arrows when there is a volume spike. It also paints the background when volume is growing. There is also a volume scanner for 8 tickers that will change color in real time when your other favorite tickers see volume growth and spikes.
You can customize the length of DMI, the number of bars to calculate the current volume average from, the number of bars back to get the overall volume average from, the multiple that needs to be hit to give a signal, the position of the scanner table and which tickers are used in the scanner. There are detailed directions as tooltips in the indicator settings you can read to understand exactly what each input does.
All features are customizable as well as which tickers the screener uses.
***HOW TO USE***
Watch for volume to pick up before placing trades as this will help you stay out of the markets when price is choppy. Volume usually brings volatility so watch for the volume signals to show up on the chart. Typically when price has made a big move one direction or is consolidating and you see the volume indicator start giving signals, the market is ready to reverse or continue its current trend but move faster in that direction.
Volume Spikes
When there is a volume spike that is larger than the average of volume over the last 100+ bars(depending on your settings) multiplied by the volume amount multiplier(in your settings) then an arrow will show up on the chart. This arrow will be green if DMI is bullish and red if DMI is bearish.
Volume Growth
A Background color will appear when the average volume over the last 5 bars(depending on your settings) is higher than the average volume over the last 100+ bars(depending on your settings) and is greater than your multiple. It will also paint the background when the volume moving average has increased over the last 3 bars consecutively. The background colors will be red or green depending on buy & sell pressure(DMI). If the background color appears, then you know volume is growing and volatility is near.
Volume Scanner
The scanner can be customized to have all of your favorite tickers by changing the tickers used in the indicator settings at the bottom. When no volume growth or spikes are detected, the ticker will show as light blue. When volume spikes or growth is detected, the ticker will turn orange to notify you.
Alerts
You can set up alerts as well when there is volume growth, bullish volume spikes and bearish volume spikes on any chart or timeframe.
Indicator Settings
Settings will need to be adjusted across different tickers as some have large swings in volume and some stay pretty even, so make sure to set up different chart layouts with settings that work for each ticker and save them individually so you don’t have to reset these values every time you switch charts.
***MARKETS***
This indicator can be used as a signal on all markets, including stocks, crypto, futures and forex as long as Tradingview has volume and DMI data for that ticker.
***TIMEFRAMES***
This volume spike indicator can be used on all timeframes as long as there is enough data for Tradingview to use for calculations.
***TIPS***
Try using numerous indicators of ours on your chart so you can instantly see the bullish or bearish trend of multiple indicators in real time without having to analyze the data. Some of our favorites are our Auto Fibonacci, Volume Profile, Momentum, Auto Support And Resistance and Money Flow Index in combination with this Volume Growth indicator. They all have real time Bullish and Bearish labels as well so you can immediately understand each indicator's trend.

Swing Assassin's Consolidated ScriptI put this script together to essentially consolidate a number of scripts that I use on a daily basis into one script. This is an ongoing improvement effort, so there may be some garbage in here right now so keep that in mind if you intend to use this to help in your trading.
There are 5 moving averages (Hull). I use the Fast, Mid and Slow to find entries after I us the Medium Slow and Super Slow to identify a trend. Otherwise, I have those three turned off.
This script also uses Bollinger Bands which I literally cannot trade without.
The script also has anchored VWAP , automated support/resistance lines, and a homebrewed Volume Profile that is a copy from Ildar Akhmetgaleev's indicator "Poor Man's Volume Profile" used under Mozilla Public License Version 2.0.

Market Profile with TPOThis is is Market Profile with TPO (the letters) on the current session. Due to pinescript limitations, we are limited to 500 TPOs, since this script uses 1 label per TPO. It is NOT volume profile, this is Time Profile (Time spent at a price).

Poor man's volume clustersVolume clusters created from candlestick volumes.
See also "Poor man's volume profile" .
The code is generated using a template. To change the settings, you may need to regenerate the code. The code has a link to the repository with the template.

Cumulative Overlapping Volume BarsThis is cheap replacement for volume profile.
Red bars is where accumulated high volume in small range.
if new bar moves out of range all accumulated volume will be lost and color will change.
Delta Volume Columns [LucF]Displays delta volume columns using intrabar volume information. Each volume column is divided into three sections: buying, selling and neutral volume. Volume for each section is determined from the volume and price movement of each intrabar at a user-selected lower resolution.
Features include:
- Choice of color themes for either dark or light chart backgrounds
- Delta volume columns
- Volume Balance displayed as the difference between the MAs of buying and selling volume
- Display of divergences between a bar’s volume balance and the bar’s price movement (example: buying volume > selling volume but close < open). Divergences can be shown in 2 different color schemes (including green/red showing a tentative direction), on volume columns and/or on chart bars
- Display of bar by bar volume balance with highlighting of above average volume
- Display of the usual total volume MA
- Choice of the lower resolution used to retrieve intrabar information
- Alerts configurable on any combination of the markers, with control over long/short direction
- Choice of 3 different markers:
1. Double bumps: two consecutive bars where buying or selling volume is in the same direction and where volume > volume MA
2. Divergence confirmations: direction of the price bar following a price/volume balance divergence
3. Volume balance shifts: zero level crossings of the volume balance MA delta
The chart shows the two main modes of display:
- Top pane : shows the stacked volume columns with divergences in orange and the flattened volume balance MAs delta at the bottom of the volume columns. This volume balance is the same shown in the bottom pane. The top pane also shows the instant volume balance strip above the volume columns. The strip’s colors show which of the buying or selling volume was greater, and colors are brighter if the total volume was above the total volume MA.
- Bottom pane : shows the volume balance MAs delta with markers 1 and 2. Given that this graphic has no price momentum component, I find quite eerie how it often looks like a momentum-based signal.
The default 5 minute intrabar resolution is used in combination with the weekly chart, which is excessive.
This script uses a special characteristic of the security() function’s behavior when it is sent to a resolution lower than the chart’s resolution. Details are given in the script’s comments. This method has the advantage of working under more circumstances than some of the other loop-based methods, but it also has its limits.
IMPORTANT
This is what you need to know:
- The method used does not work on the realtime bar—only on historical bars. Consequently, the volume column shown on the realtime bar is a normal volume column plotted in green or red, following price movement. The column will only show delta volume information after it closes and becomes a historical bar.
- The indicator only works on some chart resolutions: 5, 10, 15 and 30 minutes, 1, 2, 4, 6, and 12 hours, 1 day, 1 week and 1 month. The script’s code can be modified to run on other resolutions, but chart resolutions must be divisible by the lower resolution used for intrabars.
- Intrabar resolutions can be selected from 1, 5, 15, 30, 45 minutes, 1, 2, 3, 4 hours, 1 day, 1 week and 1 month. The intrabar resolution must of course be smaller than the chart’s resolution.
- Contrary to my other indicators where alerts must be configured to trigger “Once Per Bar Close” in order to avoid false triggers (or repainting), all this indicator’s alerts are designed to trigger using previous bar information since the indicator’s calculations in the realtime bar are not exact. Markers are not plotted with a negative offset; they appear at the beginning of the realtime bar following confirmation of the marker’s condition on the previous bar. Alerts for this indicator should thus be configured to trigger “Once Per Bar” so they trigger at the beginning of the realtime bar. Note that the penalty is not that great, as it is simply the instant between the close of the previous realtime bar and the opening of the next. The advantage of using this technique is that the indicator does not repaint; a marker that appears at the beginning of the realtime bar will never disappear.
- The script only plots information that is reliable in the realtime bar, i.e., total volume and markers. All other plots are set to n/a to prevent misleading traders.
- When the difference between the chart’s resolution and the lower resolution is too important, volume columns will not calculate for all bars in the dataset.
On Delta Volume
Buying or selling volume are misnomers, as every unit of volume transacted is both bought and sold by 2 different traders. There is no such thing as “buy only” or “sell only” volume, but trader lingo is riddled with original fabulations.
Without access to order book information, traders work with the assumption that when price moves up during a bar, there was more buying pressure than selling pressure. The built-in volume indicator available on TradingView uses this logic to color the volume columns green or red. While this script’s numbers are more precise because it analyses a number of intrabars to calculate its information, it uses the exact same imperfect logic to calculate its buying/selling/neutral sections.
Until Pine scripts can have access to how much volume was transacted at the bid/ask prices, our so-called buying/selling volume information will always be a mere proxy.
Divergences
You may wonder how there can be divergences between buying/selling volume information and price movement. This will sometimes be due to the methodology’s shortcomings we have just discussed, but divergences may also occur in instances where because of order book structure, it takes less volume to increase the price of an asset than it takes to decrease it.
As usual, divergences are points of interest because they reveal imbalances, which may or may not become turning points. I do not share the overwhelming enthusiasm traders have for divergences. To your pattern-hungry brain, the orange bars this indicator shows on chart will—as divergences on other indicators do–appear to often indicate turnarounds. My opinion is that reality is generally quite sobering, as many who have tried building automated rules based on divergences will tell you. I do not have hard numbers on the lack of performance of divergences—only many failed attempts to make them perform, which a few experienced strategy modelers I know share with me. Please don’t try to read too much into them. While they look great on past data, I find they are often difficult to use in realtime to make bets with good odds.
Thanks to:
- A guy called Kuan who commented on a Backtest Rookies presentation of an intrabar delta volume indicator using a for loop. The heart of “my” indicator is code borrowed from Kuan; I just built a hopefully useful wrapper around it.
- @theheirophant, my partner in the exploration of the sometimes weird abysses of security() ’s behavior at lower resolutions.

Punji's Dynamic Monthly EMA/SMA 5,9,21,50Punji's Dynamic Monthly EMA/SMA 5,9,21,50
Overview:
This indicator displays monthly timeframe moving averages as horizontal dotted lines extending to the right of your chart, regardless of what timeframe you're currently viewing. It includes four key monthly moving averages: EMA 5, EMA 9, EMA 21, and SMA 50.
━━━━━━━━━━━━━━━━━━━━━━━━━━━━━━━━━━━━━━━━
Key Features:
Clean Chart Design
Unlike traditional moving average lines that clutter your chart with curves across all candles, this indicator uses horizontal dotted lines that extend only from the current price level to the right edge of your screen. The dotted line style creates clear visual breaks while maintaining readability.
Multi-Timeframe Analysis
View monthly moving averages on any timeframe (1min, 5min, 15min, 1hr, 4hr, daily, weekly, etc.) without switching charts. Perfect for traders who want to see the highest timeframe context while trading any lower timeframe.
Fully Customizable
Toggle each moving average on/off independently
Adjust the period length for each MA (default: 5, 9, 21, 50)
Customize colors for each line (default gradient: green → teal → yellow → red)
Master toggle to show/hide all monthly lines at once
All lines use dotted style for clear visual distinction
Professional Color Scheme
EMA 5: Bright Green (#4CAF50)
EMA 9: Teal (#009688)
EMA 21: Yellow (#FFEB3B)
SMA 50: Light Red (#FF6B6B)
━━━━━━━━━━━━━━━━━━━━━━━━━━━━━━━━━━━━━━━━
Benefits of Horizontal Dotted Lines:
Reduced Visual Noise
Horizontal lines keep your price action clean and easy to read while still providing critical monthly support/resistance levels. The dotted style adds visual distinction without being overwhelming.
Focus on Current Monthly Levels
What matters most is where the monthly MAs are NOW relative to price - horizontal lines highlight this instantly without requiring you to trace curved lines backward through history.
Better Price Action Visibility
See candlestick patterns, volume profiles, and support/resistance levels clearly without MA lines crossing through them. Your chart remains uncluttered and analysis-ready.
Quick Reference for Monthly Context
Instantly identify if price is above or below key monthly moving averages without following curved lines across the chart. Perfect for all traders who need to respect monthly structure and major trend direction.
Professional Appearance
Clean, minimalist design with dotted lines preferred by institutional traders and technical analysts who value both aesthetics and functionality.
━━━━━━━━━━━━━━━━━━━━━━━━━━━━━━━━━━━━━━━━
Use Cases:
Position Traders & Investors
Monitor monthly moving averages for major trend direction and long-term support/resistance zones. Monthly levels are among the most significant in technical analysis.
Swing Traders
Track monthly moving averages as major dynamic support/resistance levels for position sizing and risk management. Monthly levels often represent the strongest market structure.
Multi-Timeframe Analysis
Combine with daily and weekly charts to see complete timeframe confluence. Monthly levels provide the macro trend context for all trading decisions.
Trend Identification
Quickly identify monthly trend direction and major reversal zones. When price is above all monthly MAs, the macro trend is bullish; below all MAs indicates bearish monthly structure.
Risk Management
Use monthly moving averages as ultimate stop-loss zones for long-term positions. Breaking monthly MAs often signals significant trend changes.
━━━━━━━━━━━━━━━━━━━━━━━━━━━━━━━━━━━━━━━━
Technical Specifications:
Pine Script v5
Timeframe: Monthly (M)
Moving Averages: EMA 5, EMA 9, EMA 21, SMA 50
Line Style: Dotted (all lines)
Line Width: 2
Overlay: True (displays on main chart)
Resource Usage: Minimal (4 security calls)
━━━━━━━━━━━━━━━━━━━━━━━━━━━━━━━━━━━━━━━━
Best Practices:
Combine with PUNJI Dynamic Daily & Weekly EMA/SMA Indicators
For the ultimate multi-timeframe analysis, use this monthly indicator alongside "Punjis Dynamic Daily EMA/SMA 5,9,21,50,100,200 Levels" (solid lines) and "Punji's Dynamic Weekly EMA/SMA 5,9,21,50" (dashed lines). The three PUNJI indicators together provide complete insight into daily, weekly, and monthly market structure without cluttering your chart. Daily = Solid lines, Weekly = Dashed lines, Monthly = Dotted lines. This combination gives you a complete view of all major timeframe levels simultaneously.
Respect Monthly Structure
Monthly moving averages carry the most significant weight in technical analysis. Use them as major support/resistance zones and ultimate trend filters for all your trading decisions.
Customize to Your Strategy
Adjust the lengths and colors to match your personal trading methodology. Some traders prefer different EMA/SMA periods based on their market and investment timeframe.
Keep Charts Clean
Toggle off lines you're not actively using to maintain maximum chart clarity. The master toggle allows quick show/hide of all monthly levels.
━━━━━━━━━━━━━━━━━━━━━━━━━━━━━━━━━━━━━━━━
This indicator is perfect for traders and investors who want to maintain awareness of monthly market structure and major trend direction while keeping their charts clean, professional, and easy to read.

Punji's Dynamic Weekly EMA/SMA 5,9,21,50Punji's Dynamic Weekly EMA/SMA 5,9,21,50
Overview:
This indicator displays weekly timeframe moving averages as horizontal dashed lines extending to the right of your chart, regardless of what timeframe you're currently viewing. It includes four key weekly moving averages: EMA 5, EMA 9, EMA 21, and SMA 50.
━━━━━━━━━━━━━━━━━━━━━━━━━━━━━━━━━━━━━━━━
Key Features:
Clean Chart Design
Unlike traditional moving average lines that clutter your chart with curves across all candles, this indicator uses horizontal dashed lines that extend only from the current price level to the right edge of your screen. The dashed line style creates clear visual breaks while maintaining readability.
Multi-Timeframe Analysis
View weekly moving averages on any intraday timeframe (1min, 5min, 15min, 1hr, 4hr, daily, etc.) without switching charts. Perfect for traders who want to see higher timeframe context while trading shorter timeframes.
Fully Customizable
Toggle each moving average on/off independently
Adjust the period length for each MA (default: 5, 9, 21, 50)
Customize colors for each line (default gradient: green → teal → yellow → red)
Master toggle to show/hide all weekly lines at once
All lines use dashed style for clear visual distinction
Professional Color Scheme
EMA 5: Bright Green (#4CAF50)
EMA 9: Teal (#009688)
EMA 21: Yellow (#FFEB3B)
SMA 50: Light Red (#FF6B6B)
━━━━━━━━━━━━━━━━━━━━━━━━━━━━━━━━━━━━━━━━
Benefits of Horizontal Dashed Lines:
Reduced Visual Noise
Horizontal lines keep your price action clean and easy to read while still providing critical weekly support/resistance levels. The dashed style adds visual interest without being overwhelming.
Focus on Current Weekly Levels
What matters most is where the weekly MAs are NOW relative to price - horizontal lines highlight this instantly without requiring you to trace curved lines backward through history.
Better Price Action Visibility
See candlestick patterns, volume profiles, and support/resistance levels clearly without MA lines crossing through them. Your chart remains uncluttered and analysis-ready.
Quick Reference for Weekly Context
Instantly identify if price is above or below key weekly moving averages without following curved lines across the chart. Perfect for intraday traders who need to respect weekly structure.
Professional Appearance
Clean, minimalist design with dashed lines preferred by institutional traders and technical analysts who value both aesthetics and functionality.
━━━━━━━━━━━━━━━━━━━━━━━━━━━━━━━━━━━━━━━━
Use Cases:
Day Traders
Monitor higher timeframe weekly levels on intraday charts (5min, 15min, 1hr) to stay aware of major support/resistance zones and trend direction from the weekly perspective.
Swing Traders
Track weekly moving averages as dynamic support/resistance levels for position entries and exits. Weekly levels often act as strong magnets for price action.
Multi-Timeframe Analysis
Combine with daily or 4-hour charts to see multiple timeframe confluence without cluttering your workspace with overlapping curved lines.
Trend Identification
Quickly identify weekly trend direction and potential reversal zones. When price is above all weekly MAs, the weekly trend is bullish; below all MAs indicates bearish weekly structure.
Clean Workspace Trading
Ideal for price action traders who need clean charts for pattern recognition, order flow analysis, and technical setups without visual interference from traditional moving averages.
━━━━━━━━━━━━━━━━━━━━━━━━━━━━━━━━━━━━━━━━
Technical Specifications:
Pine Script v5
Timeframe: Weekly (W)
Moving Averages: EMA 5, EMA 9, EMA 21, SMA 50
Line Style: Dashed (all lines)
Line Width: 2
Overlay: True (displays on main chart)
Resource Usage: Minimal (4 security calls)
━━━━━━━━━━━━━━━━━━━━━━━━━━━━━━━━━━━━━━━━
Best Practices:
Combine with PUNJI Dynamic Daily & Monthly EMA/SMA Indicators
Use this alongside "Punjis Dynamic Daily EMA/SMA 5,9,21,50,100,200 Levels" (solid lines) and "Punji's Dynamic Monthly EMA/SMA 5,9,21,50" (dotted lines) for complete multi-timeframe analysis. The three indicators together provide comprehensive insight into daily, weekly, and monthly market structure without cluttering your chart. Daily = Solid lines, Weekly = Dashed lines, Monthly = Dotted lines.
Respect Weekly Structure
Weekly moving averages carry significant weight in the market. Use them as major support/resistance zones and trend filters for your trading decisions.
Customize to Your Strategy
Adjust the lengths and colors to match your personal trading methodology. Some traders prefer different EMA/SMA periods based on their market and timeframe.
Keep Charts Clean
Toggle off lines you're not actively using to maintain maximum chart clarity. The master toggle allows quick show/hide of all weekly levels.
━━━━━━━━━━━━━━━━━━━━━━━━━━━━━━━━━━━━━━━━
This indicator is perfect for traders who want to maintain awareness of weekly market structure while keeping their charts clean, professional, and easy to read.
